
The natural sweetener market is growing faster than the broader food ingredient market — and the gap is widening. Consumer rejection of artificial sweeteners and high-fructose corn syrup, regulatory pressure on refined sugar, and the global rise of health-conscious purchasing are driving structural demand shifts, not cycles. For well-positioned suppliers and buyers, natural sweetener market trends in 2026 read less like a forecast and more like an instruction manual. This report condenses the current data into what procurement, strategy, and product development teams actually need to act on.
⭐ The headline numbers: USD 25.8 billion in 2024, projected USD 38–42 billion by 2030, at a 7.2% CAGR — more than double the total sweetener market’s 3.4%. Volume runs about 12 million metric tons annually, and clean-label reformulation — not health fads — is the engine behind natural sweetener industry growth. It also sets the tone for the natural sweetener market trends below.
The Numbers Behind Natural Sweetener Market Trends
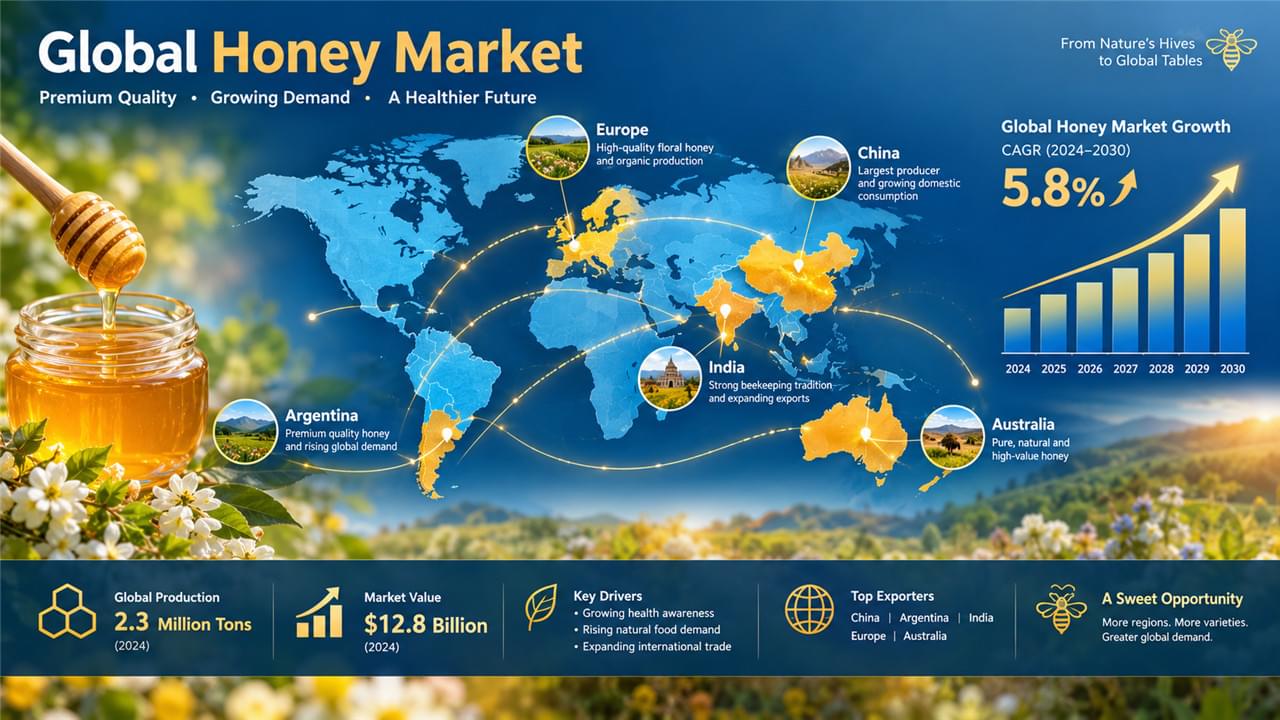
Honey remains the largest single segment within the category, and its trajectory anchors most natural sweetener market trends:
| Metric | 2024 Value | 2030 Projection |
|---|---|---|
| Market size | USD 9.4 billion | USD 13.5 billion |
| CAGR | ~4.8% | — |
| Volume | ~1.9 million metric tons | ~2.5 million metric tons |
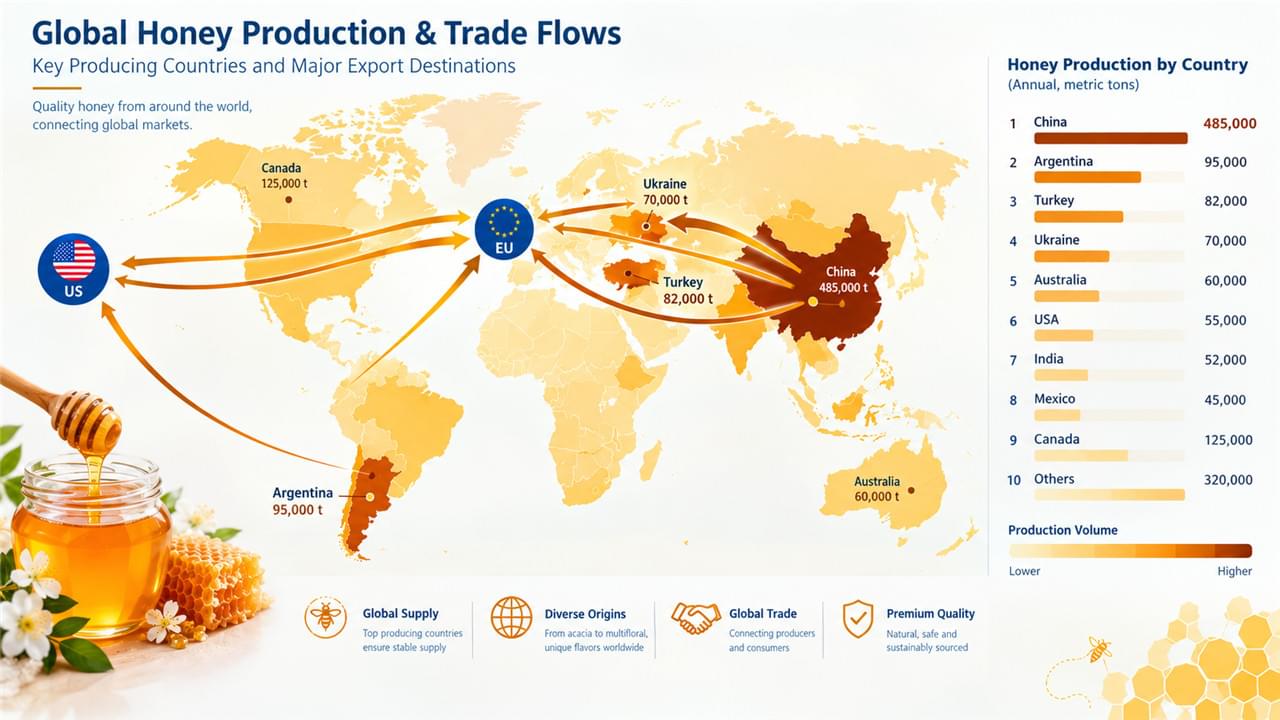
| Top 3 producers | China (~30%), India (~8%), Argentina (~6%) | Stable concentration |
| Fastest growing segments | Premium monofloral; organic; functional/nutraceutical | — |
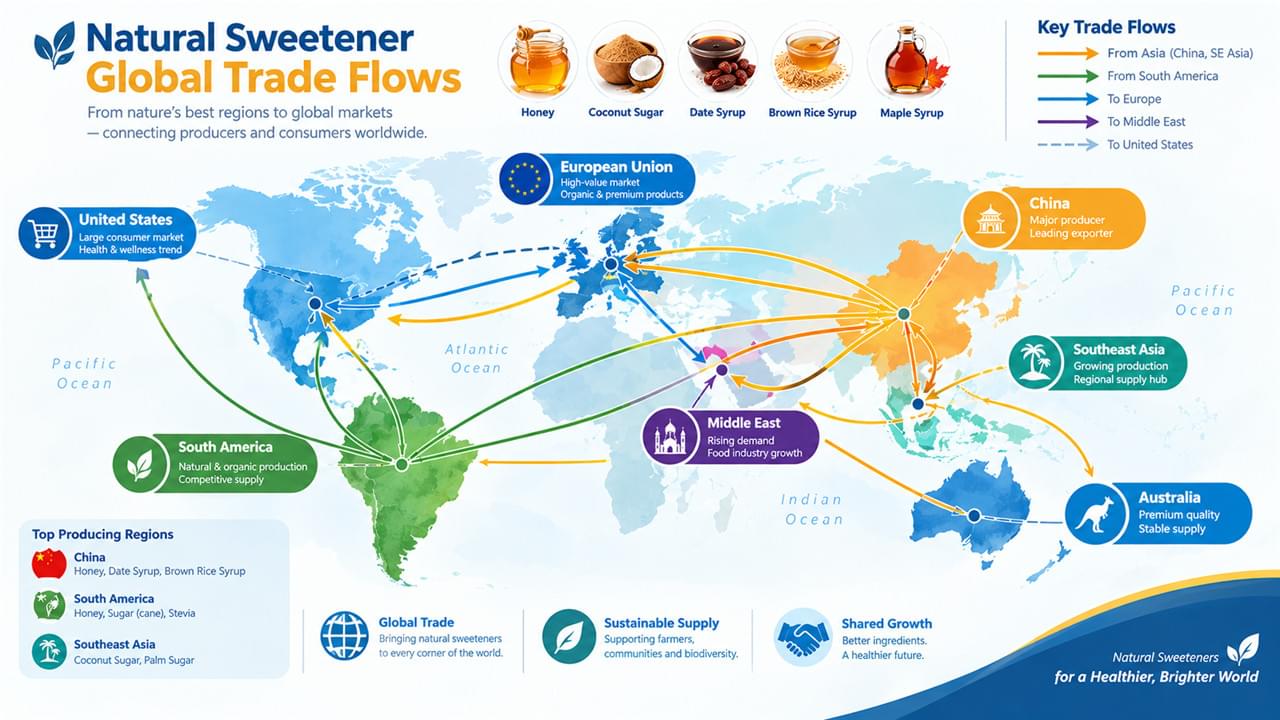
Production is concentrated but consumption is global — which is exactly why the global honey trade data from the International Trade Centre matters when you’re stress-testing a sourcing strategy. The FAO’s honey trade statistics tell the same story from the production side.
Five Shifts Reshaping Natural Sweetener Market Trends
Shift 1: Clean-Label Reformulation
The single largest driver is manufacturers replacing artificial sweeteners, HFCS, and refined sugar in response to consumer pressure. The evidence is consistent: 67% of global consumers check ingredient labels (Nielsen 2024), 42% actively avoid HFCS (IFIC 2024), and products featuring “made with honey” or “real maple syrup” keep outperforming category averages in US natural food retail. Mintel’s clean-label consumer research confirms the pattern across markets. For B2B buyers, clean label reformulation means sustained procurement demand as projects roll through bakery, beverages, sauces, and dairy — it’s the quiet force underneath every one of this year’s natural sweetener market trends.
Shift 2: Functional and Premium Positioning
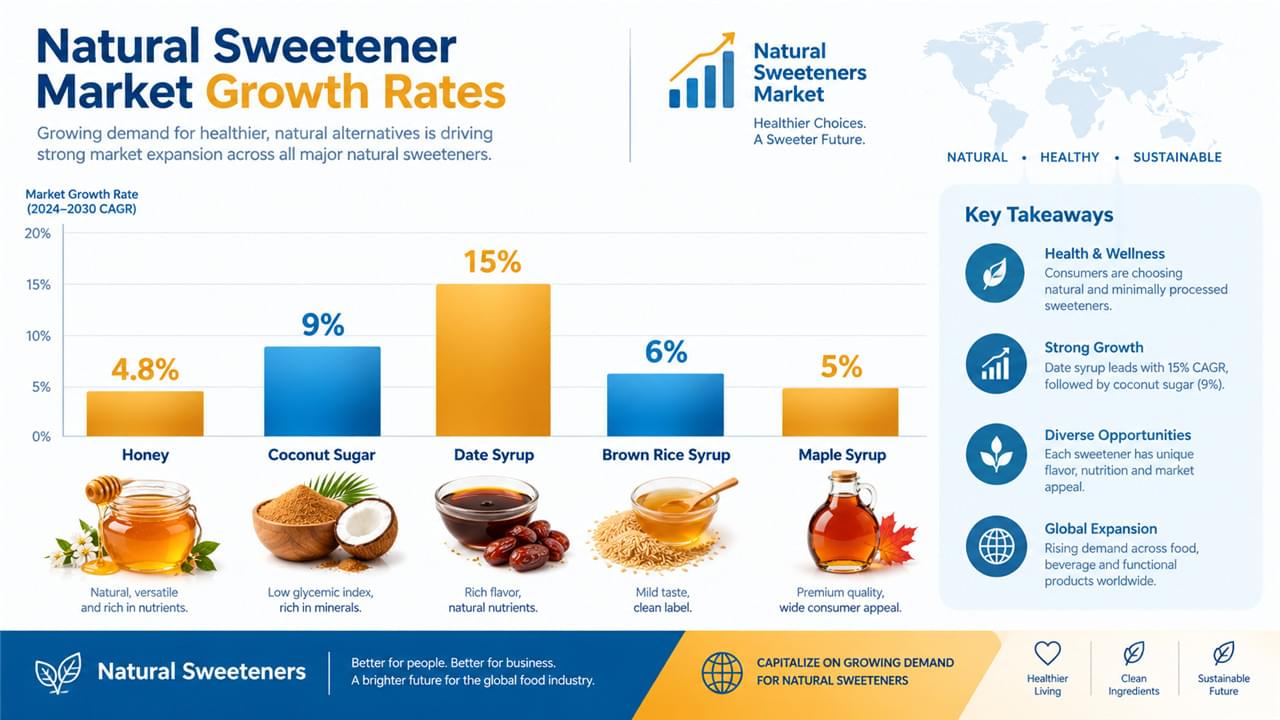
Nutritional storytelling is moving products up the price curve. Manuka honey grows at a 12%+ CAGR with NZ export value reaching NZD 400M in 2023; buckwheat honey rides antioxidant positioning in North America; coconut sugar sustains 8%+ annual growth on low-GI claims despite higher cost; and date syrup was the fastest-growing alternative sweetener in EU natural retail through 2023–2024. Premium here isn’t decoration — it’s where natural sweetener market trends turn into margin protection.
Shift 3: Emerging Middle-Class Demand
Rising disposable incomes across Asia, the Middle East, and Africa are turning natural sweeteners into an aspiration category. Southeast Asian honey consumption grows above 6% annually with the HALAL segment particularly strong; GCC premium imports (Sidr, Manuka, European wildflower) thrive as gift products; India’s adoption curve is climbing with health awareness.
Shift 4: Traceability and the Authentication Premium
Verified origin honey now commands 15–40% premiums over commodity product. Blockchain-tracked supply chains are emerging as premium positioning tools, and “farm to jar” narratives are pulling procurement closer to origin. Among 2026’s natural sweetener market trends, authentication is the one with a direct line to price.
Shift 5: Climate Risk Enters the Price Equation
Climate volatility is now documented across the category: bee colony health suffers under temperature extremes, drought cuts flowering, maple’s freeze-thaw season is shortening with Quebec’s industry documenting a northward shift, and agave production in Jalisco swings with drought. Buyers sourcing for price stability need multi-origin procurement strategies — single-region concentration is now a quantifiable risk, not a hypothetical.
Natural Sweetener Market Trends by Region
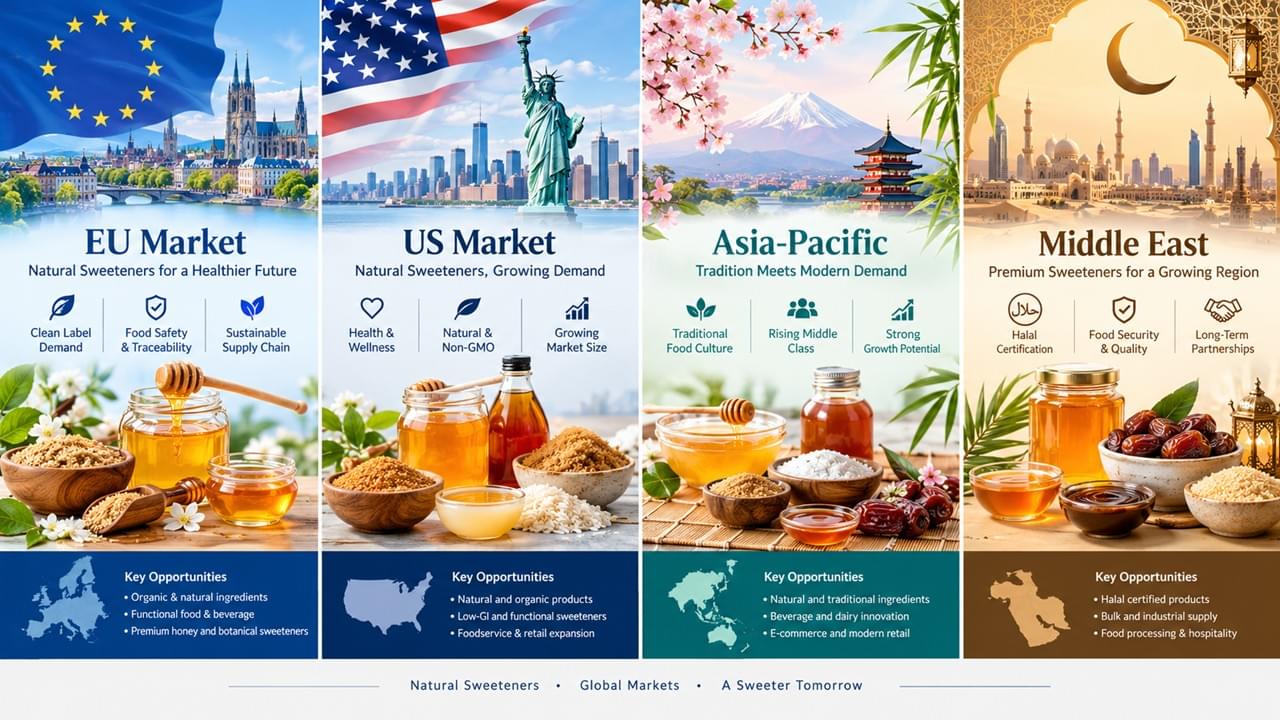
Four regional stories dominate natural sweetener market trends this year:
Europe — the world’s largest honey import market at ~45% of global trade value. Consumption runs ~350,000 MT/year against ~200,000 MT of production (57% self-sufficiency), sourced mainly from China, Ukraine, Argentina, Mexico, and Turkey. Germany leads EU per-capita consumption. The trend line: organic, origin-labeled, traceable honey, with adulteration enforcement creating quality-premium opportunity.
North America — the US honey market hits USD 2.2 billion retail, growing 3.8% annually. Domestic production of 60,000–80,000 MT covers only ~35% of demand; India, Canada, Brazil, Vietnam, and Argentina fill the gap. Organic, local, and varietal honey outgrow the total market, while maple and agave hold strong positions in natural retail.
Asia-Pacific — China is both the largest producer (~500,000 MT) and a significant consumer. Japan combines high per-capita consumption with strict quality standards — a premium importer’s market. Australia is scaling Manuka production as the NZ-origin variety commands global premiums.
Middle East and Africa — GCC countries drive strong HALAL honey demand; Saudi Sidr from Hadramaut sits at the top of the luxury tier. Ethiopia and Tanzania are emerging as export origins worth watching for EU and Asian buyers.
Alternative Sweetener Category Trends
Alternative categories move faster than honey, and their curves shape the wider natural sweetener market trends:
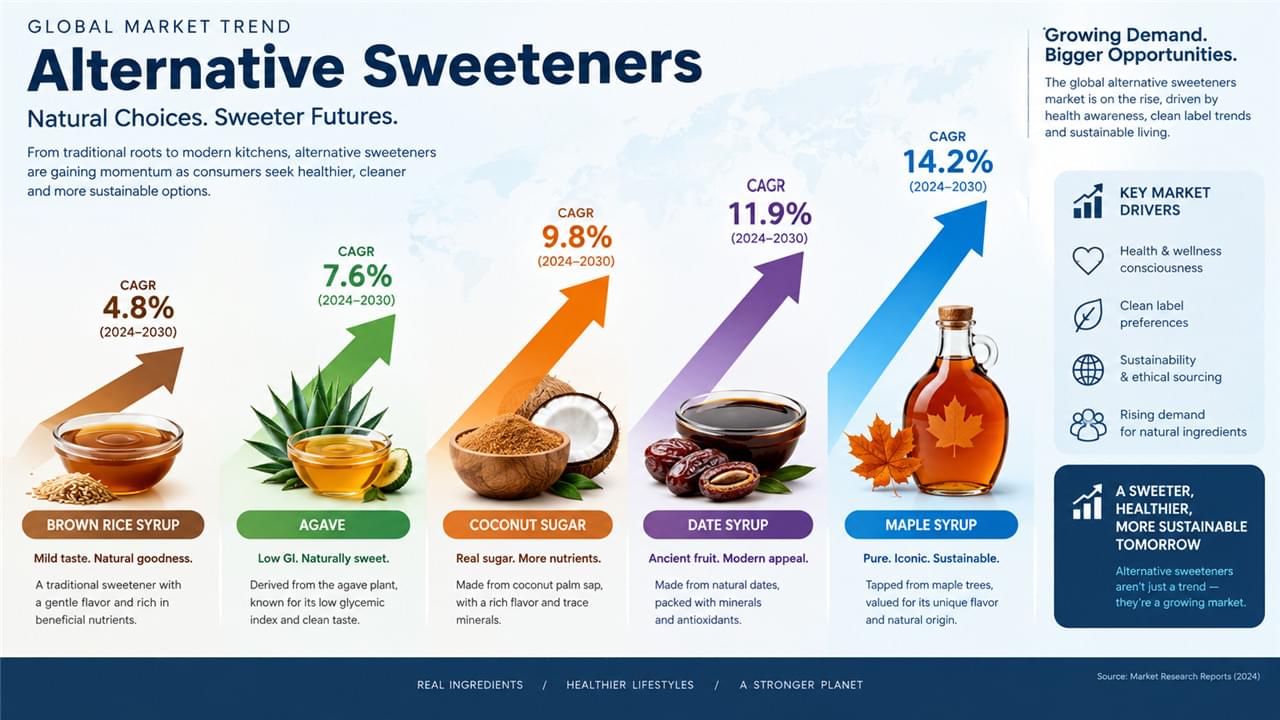
Brown rice syrup — ~USD 600M market at ~6% CAGR. Strong in energy bars, granola, infant nutrition, and craft brewing, with one formulation caution: FDA inorganic arsenic advisories for rice-based infant products.
Agave nectar — stabilizing after its early-2010s boom. Lower-GI positioning stays relevant in better-for-you beverages and snacks; the organic segment grows as conventional supply faces sustainability questions.
Coconut sugar — 8–10% CAGR on the clean-label/low-GI/sustainable trifecta, with supply concentrated in Indonesia and the Philippines.
Date syrup — the fastest-growing segment in EU/US natural specialty retail, powered by MENA authenticity positioning. Scale is still limited, but commercial supply infrastructure is catching up. For how these options compare head-to-head, see our Comparative Analysis of Sweeteners.
Where Natural Sweetener Market Trends Are Heading: B2B Outlook
Three conclusions survive contact with the data. First, demand growth is secular — clean label, health positioning, and emerging-market adoption are multi-year trends, not cycles. Second, quality differentiation will intensify: as the market scales, the gap between commodity and verified premium product widens, and buyers positioned at the quality end hold better margin protection. Third, diversify origins — climate risk and single-country regulation make multi-country sourcing capability a requirement, not a nice-to-have. The Global Honey Sourcing Guide maps origin options; the Honey Varieties Production Guide covers product selection; and the Sustainability and Ethical Sourcing page covers the story behind premium positioning, while our Natural Sweetener Quality Standards guide keeps the compliance side airtight.
For strategic sourcing consultation and market-specific supply analysis, contact our trade intelligence team.
 English
 Arabic
 French
 German
 Portuguese
 Russian
 Spanish
 Japanese
 Korean